Типология территорий Вьетнама по пожарному риску на основе кластерного анализа
Typology of Vietnam’s territories by fire risk on the basic of cluster analysis
- 1 Институт пожарной безопасности Вьетнама
Для типологии рассматривается совокупность факторов, характеризующихся экономическими, социальными, демографическими, климатическими показателями, а также показатели, учитывающие процессы урбанизации, электрификации, торговли и развития транспорта в кластерах. С точки зрения пожарных рисков выделено пять однородных кластеров провинций.
A set of factors characterized by economic, social, demographic, climatic indicators, as well as indicators that take into account processes of urbanization, electrification, trade and transport development in clusters are considered for typology. In term of fire risks, five homogeneous clusters of provinces are identified.
In fire service, the typology of Vietnam's territory (province level) according to fire risk characteristics is a new research. However, this research has a great significance in detecting the laws of socio-economic territorial differentiation in terms of fire risk characteristics, and is the basis for proposing macro-management solutions on fire safety, as well as conducts typology territories more scientific.
The typology of territories by fire risks was solved with regard to the Vietnamese provinces which are very complex and heterogeneous in fire situation.
Statement
of problem's territories typology was as follows. Let the X
be the set of different territories (X
= 63), and the Y
– the set of clusters. Function of the
distance between the territories ρ ( is given, where the i,
j are territory indices; i = 1,
…, n;
j = 1, …,
n; n
is total number of territories X =
{
 }.
The
set of territories X
is required to be divided into non-overlapping subsets ,
called clusters
Ym,
(m = 1,
…, M),
in such a way as each cluster is consisted of objects close to the ρ
metric, and the objects of different clusters are differed
substantially in the same metric. And each object
 is
assigned the cluster number
 m
= 1, …,
M.
When clustering the territories it was assumed that the fire situation indicators were characterized by equal importance factors and standardized as follows:
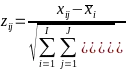 ,
(1)
where
xij
– the value
of the j-th
fire hazard indicator in the i-th
province; I
is the number of provinces equal to 63; J
– the total
number of indicators characterizing fire hazard state;
 j
– the average value of the j-th
fire hazard indicator.
The typology of territories is done based on a system of indicators reflecting the characteristics of fire hazards in Vietnam. The indicators for the residential and economic sectors are collected for the typology of Vietnam's territories.
* For residential sector, the indicators include:
- The demographic indicators: Average population of provinces (thousand people), percentage of population aged up to 20 years (%), percentage of urban population in the provinces (%).
- The indicators of natural conditions, weather and climate: Area of provinces (million km2), forest area of provinces (million km2), average temperature in January in the provinces (C), average temperature in July in the provinces (C), average rainfall in January in the provinces (mm), average rainfall in July in the provinces (mm).
- The economic indicators: Total annual income of provinces (million dollars), total annual merchandise trade value of each province (million dollars), average annual income of state employees (dollars), the number of multi-storey and high-rise buildings in the provinces, road development in each province (km/km2), area of trade centers in provinces (thousand m2).
- The indicators of the living conditions of the population: Number of houses in the provinces, percentage of households with electricity in provinces (%).
- The indicators of fire incident: Number of fires in the provinces, the number of firefighters in the provinces, number of fire trucks in the provinces, the number of fire deaths in the provinces, the number of fire injuries in the provinces, lost caused by fire in the provinces (million dollars), average damage per year per fire (thousand dollars), probability of fire per 1 residential house in residential sector in the provinces (%), number of deaths in residential sector per fire in each province (people), number of deaths in residential sector per 1.000 people of each province (10-3 people).
* For economic sector, the indicators include:
- The demographic indicator: Percentage of urban population in provinces (%).
- The indicators of natural conditions, weather and climate: Average temperature in January in the provinces (C), average temperature in July in the provinces (C), average rainfall in January in the provinces (mm), average rainfall in July in the provinces (mm).
- The economic indicator: Average annual income of state employees (dollars).
- The indicators of fire incident: Average lost per year per fire in the economic sector of provinces (thousand dollars); probability of fire on 1 facility under management in the economic sector in 1 year of provinces (%), rate of first class fire dangerous establishments per the total number of economic establishments in the provinces (%), rate of second class fire dangerous establishments per the total number of economic establishments in the provinces (%), rate of third class fire dangerous establishments per the total number of economic establishments in the provinces (%), average number of deaths per fire in the economic sector in the provinces (people), average fines for first class establishments in the economic sector in the provinces (thousand dollars), average fines for second class establishments in the economic sector in the provinces (thousand dollars), average fines for third class establishments in the economic sector in the provinces (thousand dollars), average number of fines per year for first class establishments in the economic sector in the provinces, average number of fines per year for second class establishments in the economic sector in the provinces, average number of fines per year for third class establishments in the economic sector in the provinces.
The typology of territories by fire risks is carried out according to the following algorithm:
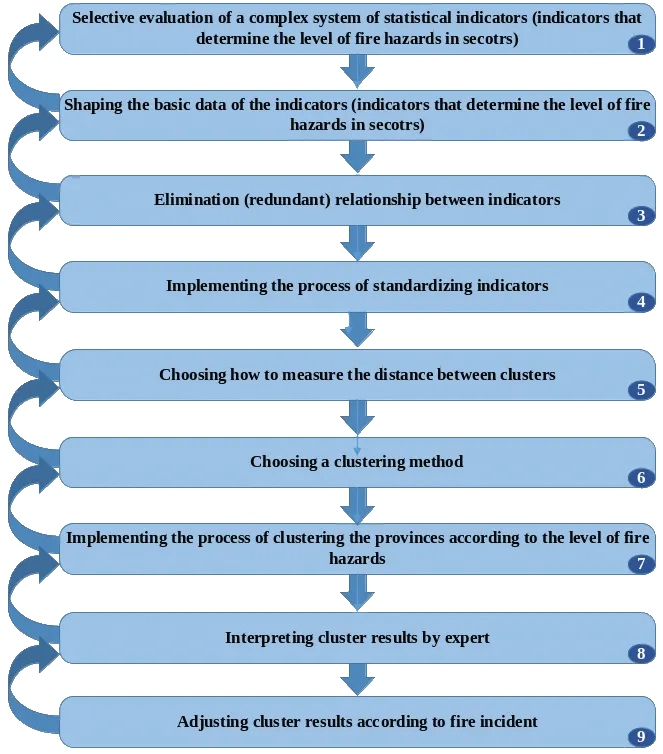
Figure 1. Algorithm for typology Vietnam's territory based on fire hazard characteristics
Using data processing software Statsoft Statistica, the results of typology of Vietnam's territory according to fire risks are shown as follows:
* For the residential sector, 63 provinces are divided into 5 clusters (see fig. 2, 3):
- Cluster 1 (11 provinces): 26 – 39;
- Cluster 2 (15 provinces): 12 – 19, 22 – 25;
- Cluster 3 (13 provinces): 1 – 11, 20, 21;
- Cluster 4 (15 provinces): 45 – 59, 60 – 63;
- Cluster 5 (9 provinces): 40 – 44.
Where: 1 – 63 is the ordinal number of provinces in Vietnam
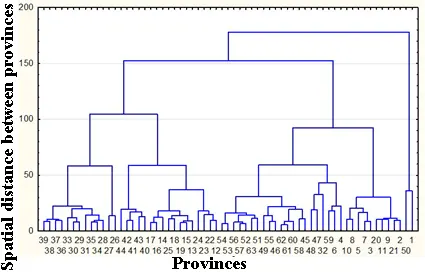
Figure 2. The tree diagram of typology of
Vietnam's territory
by fire risks in the residential sector
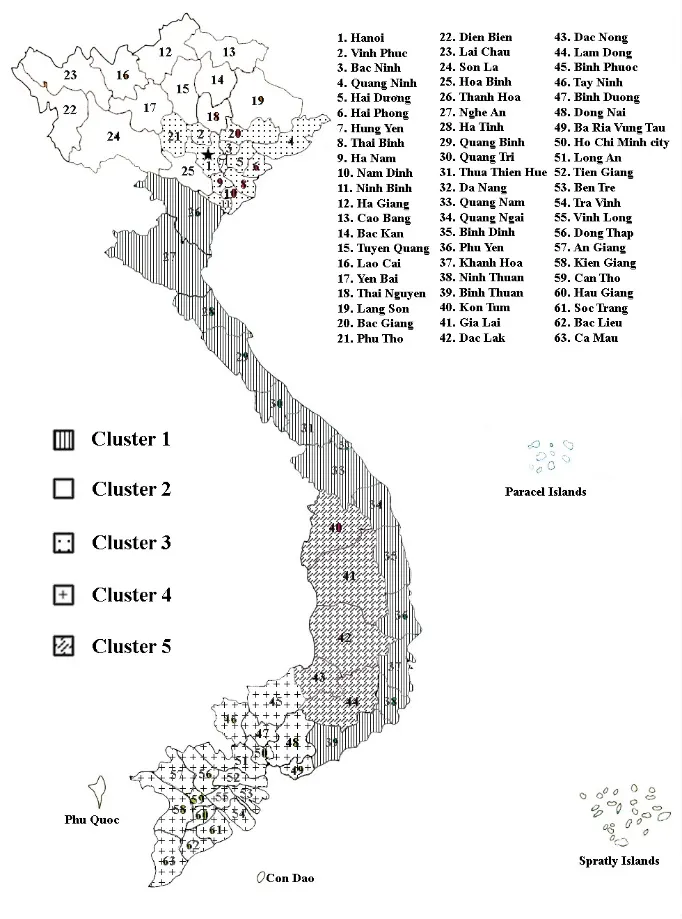
Figure 3. Typology of Vietnam's territory
by
fire risks in the residential sector
* For the economic sector, 63 provinces are divided into 5 clusters (see fig. 4, 5):
- Cluster 1 (11 provinces): 29 – 39;
- Cluster 2 (15 provinces): 1, 3, 5, 7, 12, 14 – 17, 20 – 25;
- Cluster 3 (13 provinces): 2, 4, 6, 8, 9 – 11, 13, 18, 19, 26 – 28;
- Cluster 4 (15 provinces): 45, 46, 51 – 59, 60 – 63;
- Cluster 5 (9 provinces): 40 – 44, 47 – 50.
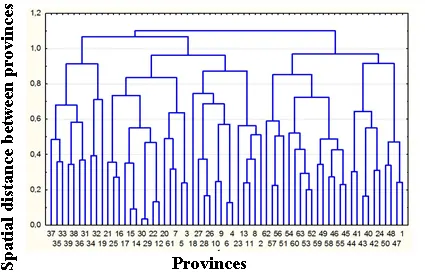
Figure 4. The tree diagram of typology of
Vietnam's territory
by fire risks in the economic sector
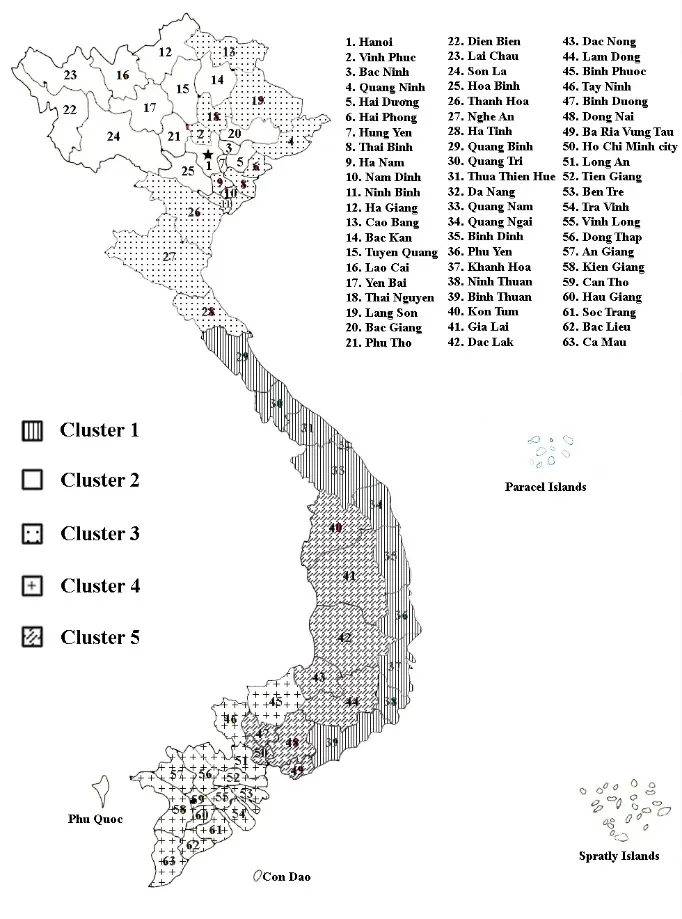
Figure 5. Typology of Vietnam's territory by fire risks
in the economic sector
* For the Vietnam's territory (regardless of the residential sector or economic sector), 63 provinces are divided into 5 clusters (see fig. 6, 7):
- Cluster 1 (12 provinces): 28 – 39;
- Cluster 2 (12 provinces): 12 – 19, 22 – 25;
- Cluster 3 (15 provinces): 1 – 11, 20, 21, 26, 27;
- Cluster 4 (19 provinces): 45 – 63;
- Cluster 5 (5 provinces): 40 – 44.
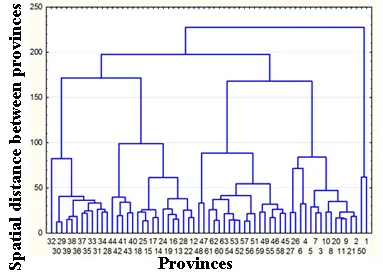
Figure 6. The tree diagram of typology of Vietnam's territory by fire risks
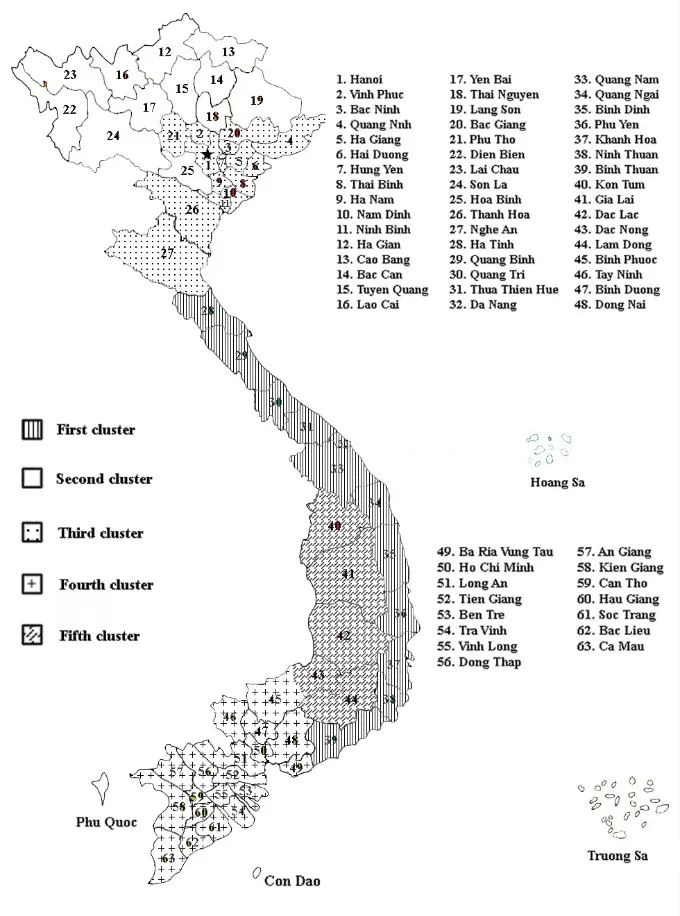
Figure 5. Typology of Vietnam's territory by fire risks
The results of typology process of Vietnam's provinces are objective and reflect the similarity in fire hazard characteristics of the provinces in the clusters. This is the scientific basis to propose measures to manage fire risks, distribute and arrange forces and means of fire prevention and fighting reasonably.
References
1. Nguyễn Viết Thịnh, Đỗ Thị Minh Đức. Phân kiểu kinh tế – xã hội cấp tỉnh và cấp huyện Việt Nam. NXB Từ điển bách khoa, 2005.
2. Дюран Б., Оделл П. Кластерный анализ. М.: Статистика, 1977. 128 с.
3. Классификация и кластер / Под ред. Дж. Вэн-Райзина. М.: Мир, 1980. 390 с.
4. Гришакина Н.И., Дмитриева В.С., Манова Н.В. и др. Многомерные статистические методы. Часть IV. Кластерный анализ: учеб.-метод. пос. Великий Новгород: изд-во НовГУ им. Ярослава Мудрого, 2005. 54 с.
5. Минаев В.А., Топольский Н.Г., Дао А. Т. Информационное обеспечение задачи типологизации территорий вьетнама по пожарной обстановке // Технологии техносферной безопасности. 2016. Вып. 6 (70). http://academygps.ru/ttb